For years now one of the most reliable complaints I hear when I try to drag a team off their vendor specific SDK and onto OpenTelemetry is some variation of: "why does it seem like this isn't done yet?"
Vendor SDKs for observability are, to put it charitably, idiot-proof. You install the thing, dashboards just load data, someone else worries about how all those pieces fit together, and you get on with your life. OpenTelemetry, by contrast, greets you at the door with a lot of "experimental" stamps and roughly six different ways to accomplish any given task.
In OpenTelemetry's defense this was never what they were going for as a project. I've always respect that they stuck to their guns by attempting to build a truly vendor agnostic system that really doesn't care what you do with the data. I have never gotten a sense of a vendor being strongly preferred with OTel, which is quite the feat considering how lucrative and contentious the observability ecosystem was. Also considering that the maintainers of this project are largely employed by exclusively those companies.
As the years wore on, I started to get nervous. Conversations in the semantic-conventions repo drag on and on and on. Different languages had dramatically different stories. Golang and Dotnet were first class citizens, but other languages lagged years behind the others.
I started asking a lot of probing questions before recommending OpenTelemetry to smaller teams who didn't have the time, budget, or emotional bandwidth for it. Auto-instrumentation was genuinely magical, but the cliff between "auto-instrument works" and "now I have to manually instrument something" was steep enough that you owed people a warning before you pushed them off it.
This narrative has been going on for awhile in the observability space, a vague sense of "something is wrong in Otel-land". But let's try to generate some actual data here. Is there an actual problem, or is this something where the perception by the community of slow progress is imaginary? Is the problem not enough maintainers, too big of a scope, or something in-between?
My guess when I started was "oh this is your classic open-source bit off more than they can chew". Not enough maintainers, not enough budget. Now there is some of that, but there's also something else going on.
The actual problem happening inside of OpenTelemetry is a three way crash. You have a binary stability gate which, when combined with a very small bench of actual maintainers means there is understandable worry about marking a feature not experimental then add on just a massive scope of languages and frameworks they are attempting to cover. This creates a perfect storm where there is an incentive to argue about potential problems a feature might create since once it is locked in and shipped as stable you can never change them.
How does OpenTelemetry Work
So OpenTelemetry currently is attempting to support a dizzying number of languages and frameworks.
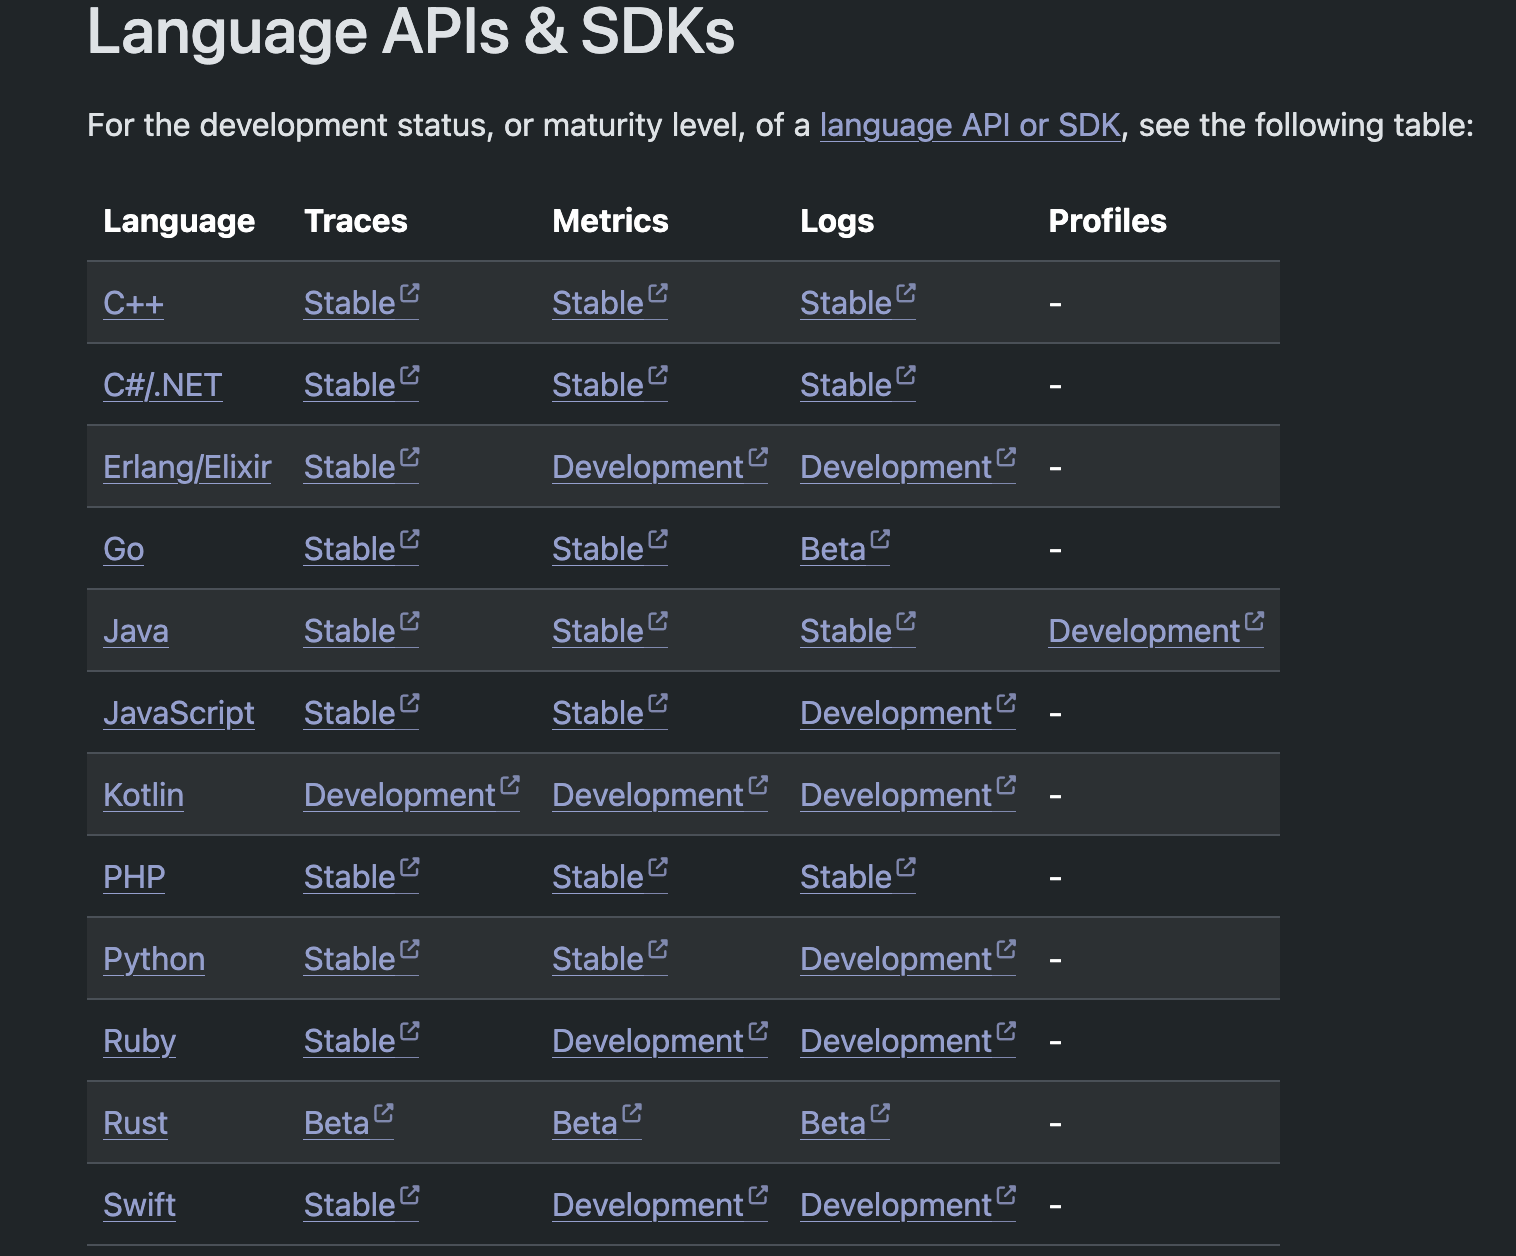
OpenTelemetry is a giant project. It spans dozens of languages, hundreds of libraries, and countless backends. To keep things sane, the project splits work into two buckets:
- Core → Maintained directly by the OTel project. Small, stable, vendor-neutral, and tightly reviewed. This is the "spec-defining" surface.
- Contrib → Community- and vendor-contributed. Broader, faster-moving, and covers the long tail of integrations.
There exists the otel-collector, the thing that runs along the thing so that you can ship logs metrics and traces. That copies the same rough pattern. But for the languages when we're talking about core vs contrib this is what we're talking about.
opentelemetry-python (core) |
The API, SDK, OTLP exporter, context propagation, resource detection primitives |
opentelemetry-python-contrib |
Instrumentation libraries for Flask, Django, requests, psycopg2, Redis, Kafka, boto3, etc. |
Stuff that breaks goes in contrib, stuff that doesn't break goes into core.
Now the reason this causes a conflict. contrib is massive overkill for most projects. You don't want 300 exporters to add the one you typically need. On the language side, this isn't that big of a problem. pip install opentelemetry-instrumentation-flask gives you the stuff you need for flask. However on the collector side you end up having to do the OpenTelemetry Collector Builder to make your own collector (or just kinda ride the wave and hope it works out). While cool that this exists, it's a lot of scope to ask a team to take on.
Process of adding a new feature
So I believe I have captured the workflow of adding a new feature to OTel. You can check my homework here:
- OpenTelemetry Enhancement Proposal (OTEP) (https://github.com/open-telemetry/opentelemetry-specification/tree/main/oteps/)
- Once the OTEP is accepted, the text goes into the Specification directory in the same repo.
- After that it seems to go to Semantic conventions. This seems to be where we get down to the specific details and where most of the long discussions seem to live. At this point we're talking about more or less a permanent commitment to this design and where the lock-in process becomes very hard to change.
- Each of the SDKs implements the API surface that is defined in the specification. Now some of the SDKs have done 2.0 breaking changes, so it does seem like the earlier "please no 2.0 at all costs" sentiment has been abandoned (which I think is smart and good).
- Contrib / instrumentation. This is slightly more mushy. Looks like they should track latest API/SDK but each contrib package may version independently so its more flexible as a design.
- Collector + OTLP. The data has to actually go somewhere. OTLP (wire protocol) has its own stability lifecycle and specification (here). Collector components have their own stability in their READMEs and as far as I can tell that's kinda all over the place.
Things I'm not really clear on
- It's unclear how long the OTEP -> Specification process takes. I've looked through the Git history but there doesn't seem to be any predictable number or cycle.
- I don't fully understand what is the relationship between all these stability commitments. Does Collector + OTLP group work in lockstep? Can a language "fall out of scope" if you lag too far behind?
Attempting to test it
So because OpenTelemetry is a CNCF project, I figured it made the most sense to compare them to other CNCF projects. My basis for comparison is Envoy and Prometheus. I have used a hacky Python script I've used before for measuring the "health" of open-source projects, which is probably not the best. However I'll include a link to the raw data without the charts so folks can review it and (more than likely) find a problem in what I generated.
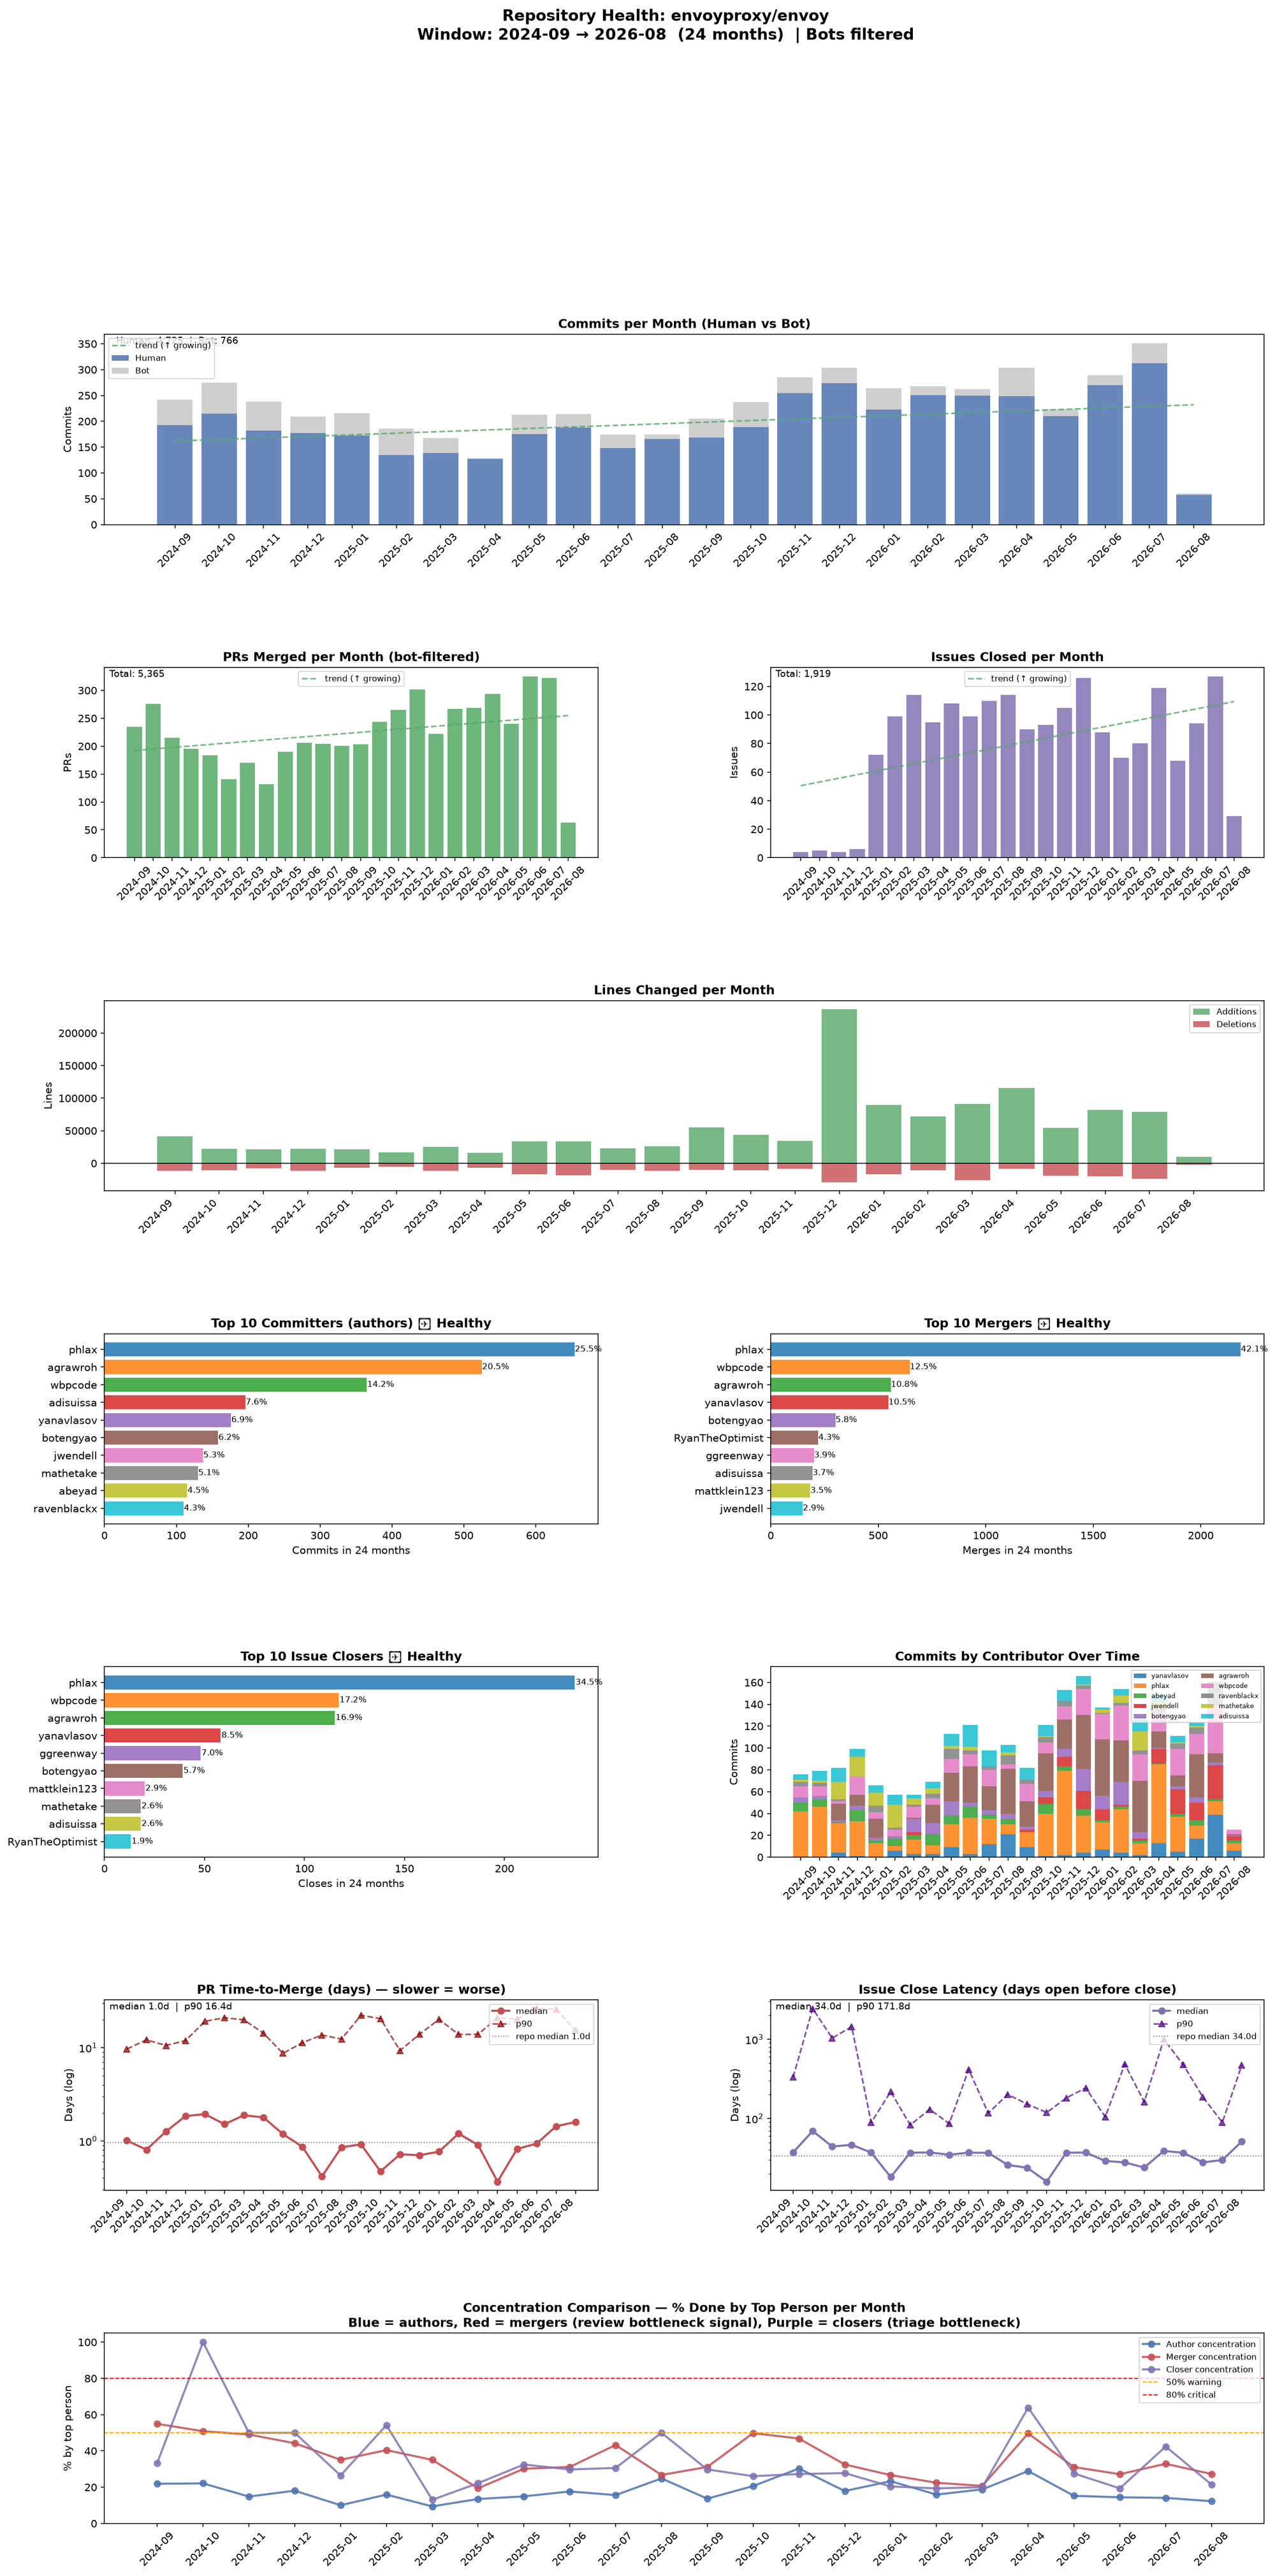
So we look at 24 months of activity for Envoy and what we see is a pretty healthy project. There's good distribution of authors, mergers, issue closers. phlax is obviously pretty important to the project but in general there's a good bench of people to step in if needed. I've attempted to filter out all the known bot traffic.
Let's compare that to one of the OpenTelemetry languages. The ones I have the most professional experience with are Golang and Python, but I hear from a lot of folks in the community that the Ruby and PHP ones struggle a lot. This is the PHP one for the same period.
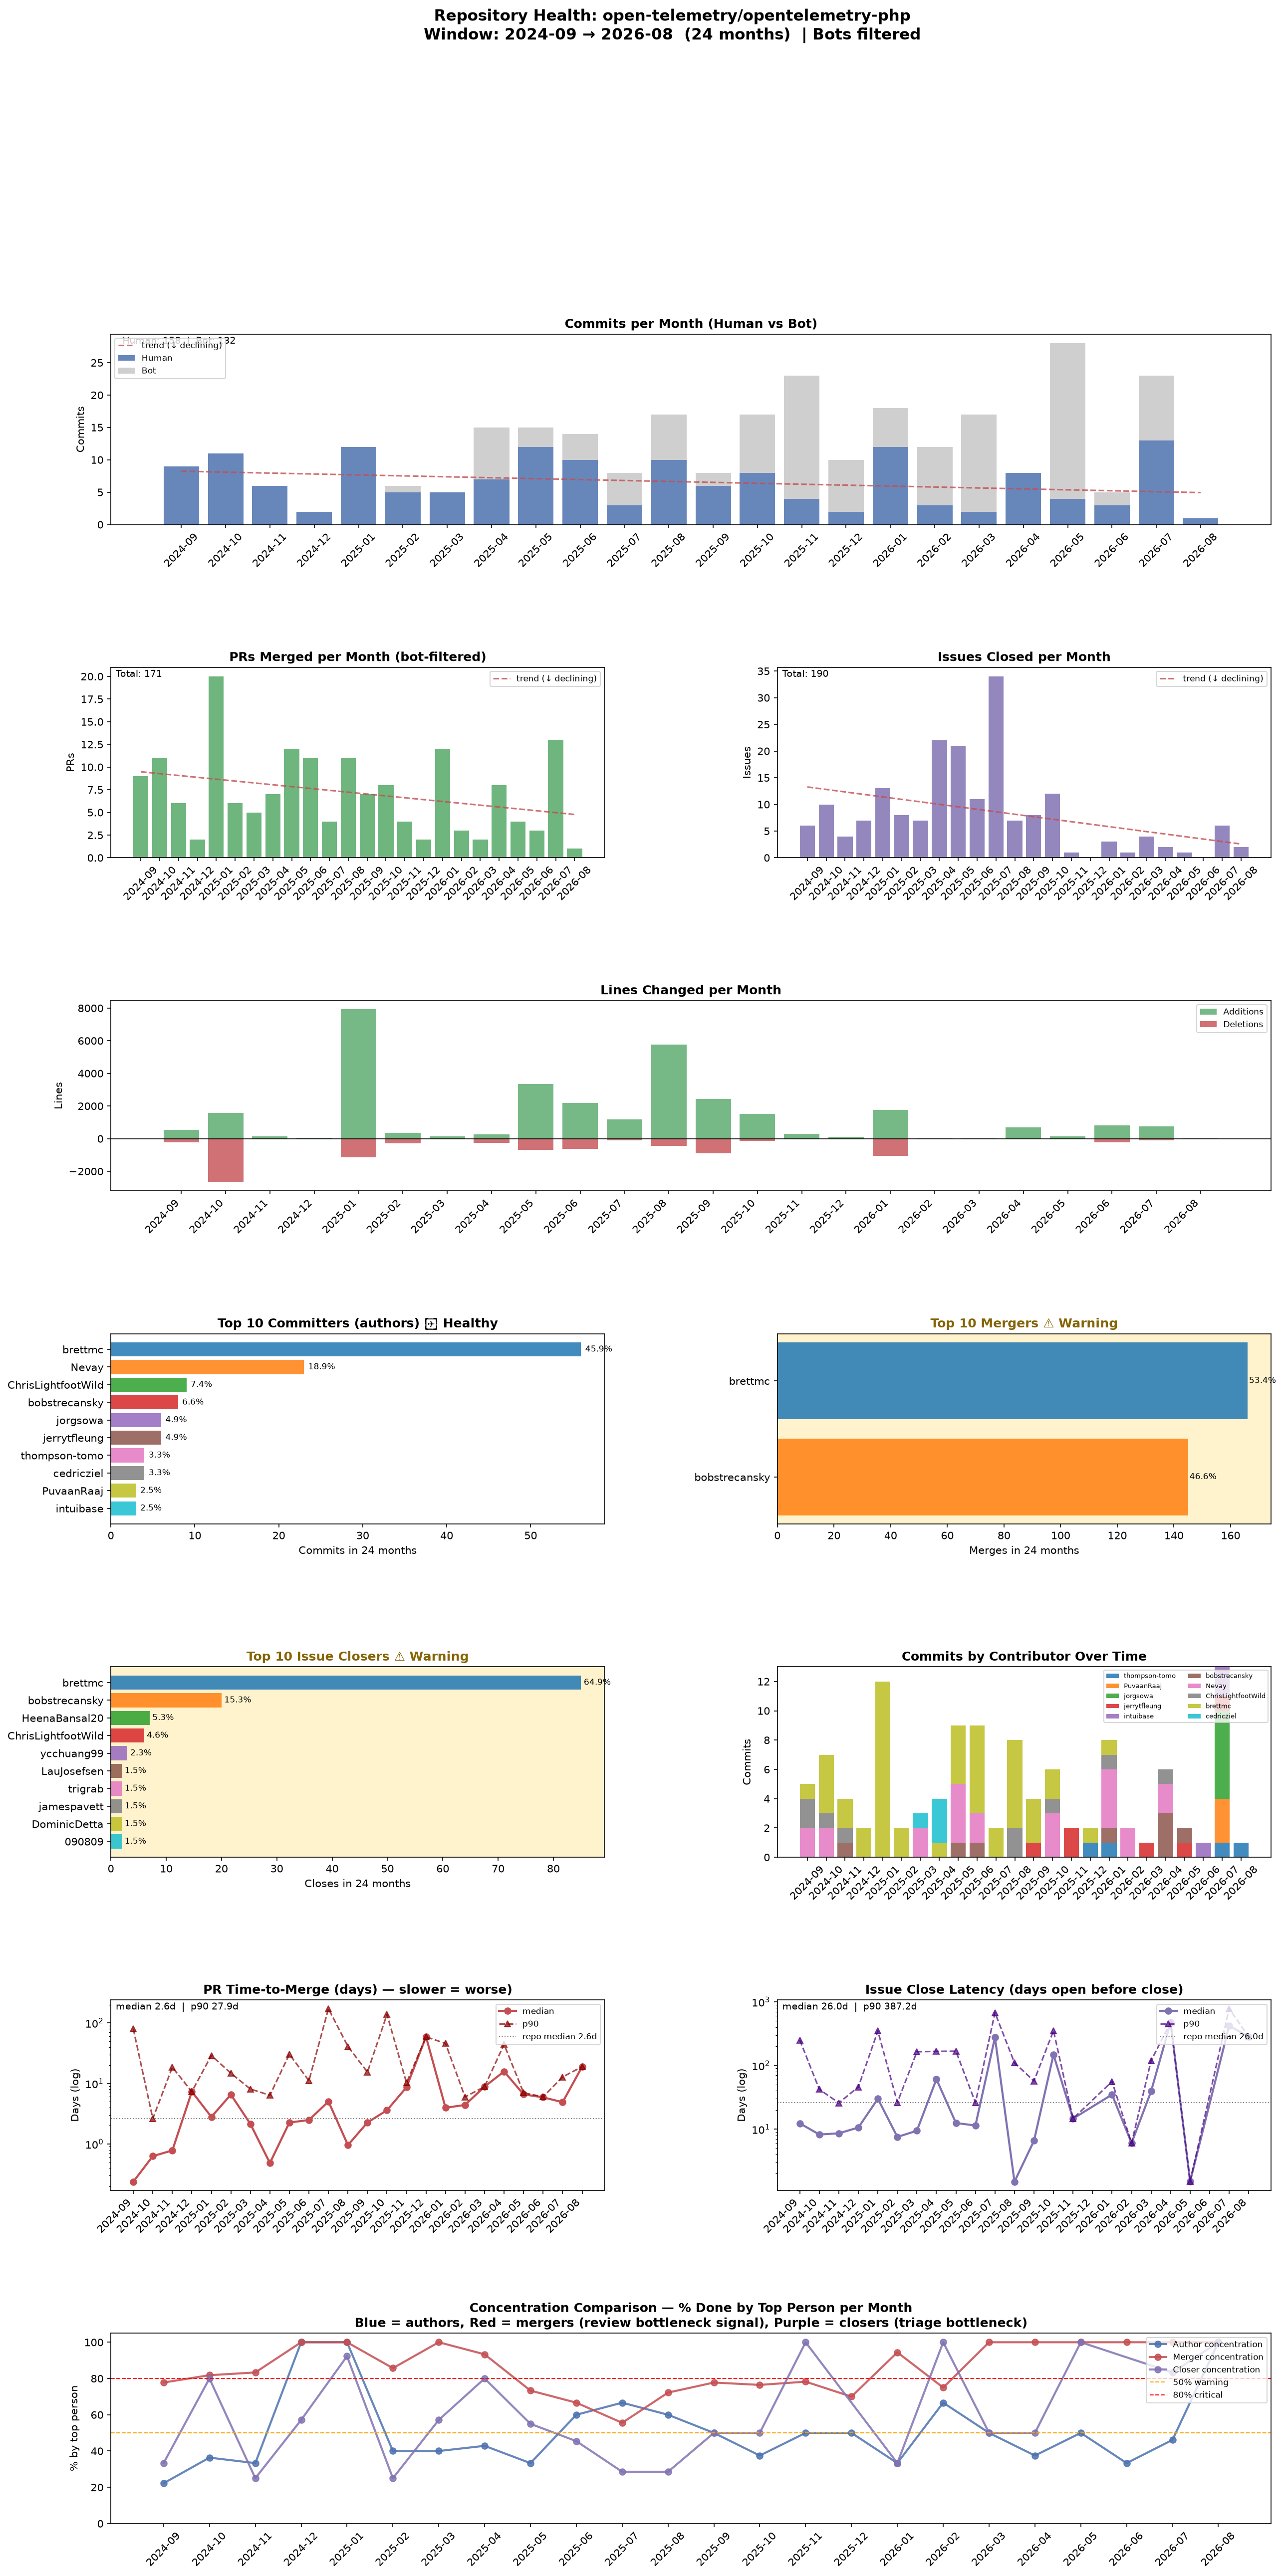
So we see pretty clearly that there's way too much concentrated on 2 people. This is not a healthy open-source project and they clearly don't have enough people to cover the kind of scope OTel needs to cover. Same story with Ruby.
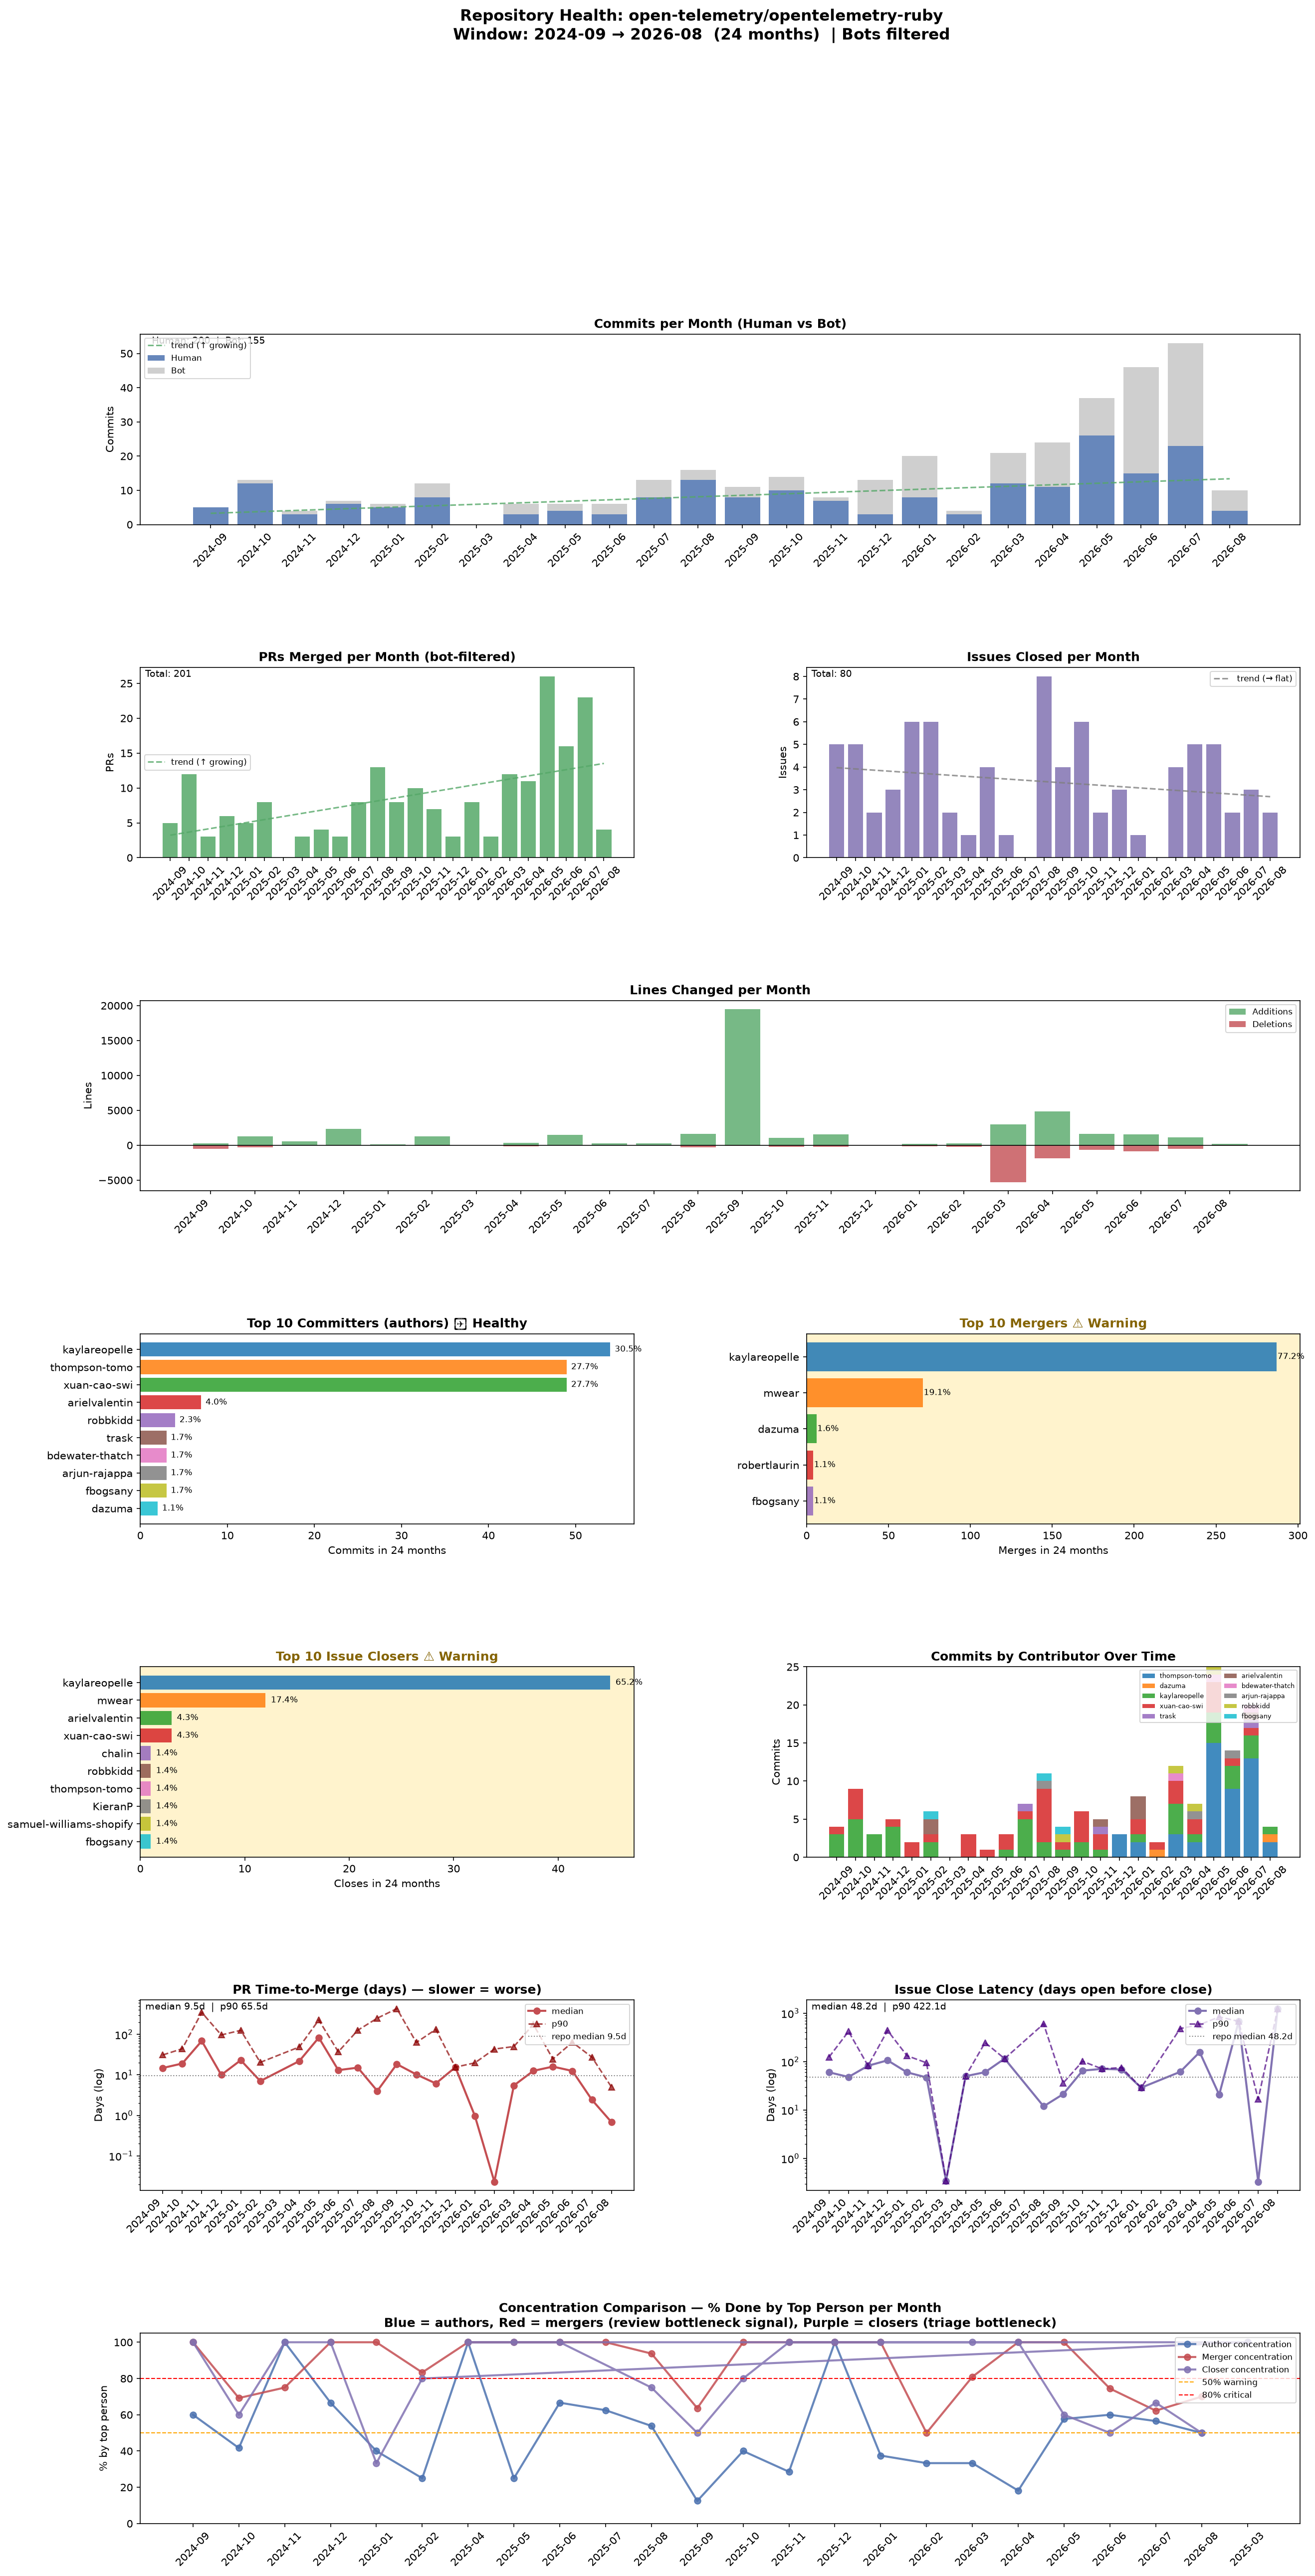
In comparison the "strongest" OpenTelemetry SDKs in my opinion, Golang and Dotnet (although Python is also no slouch) look more healthy.
Golang
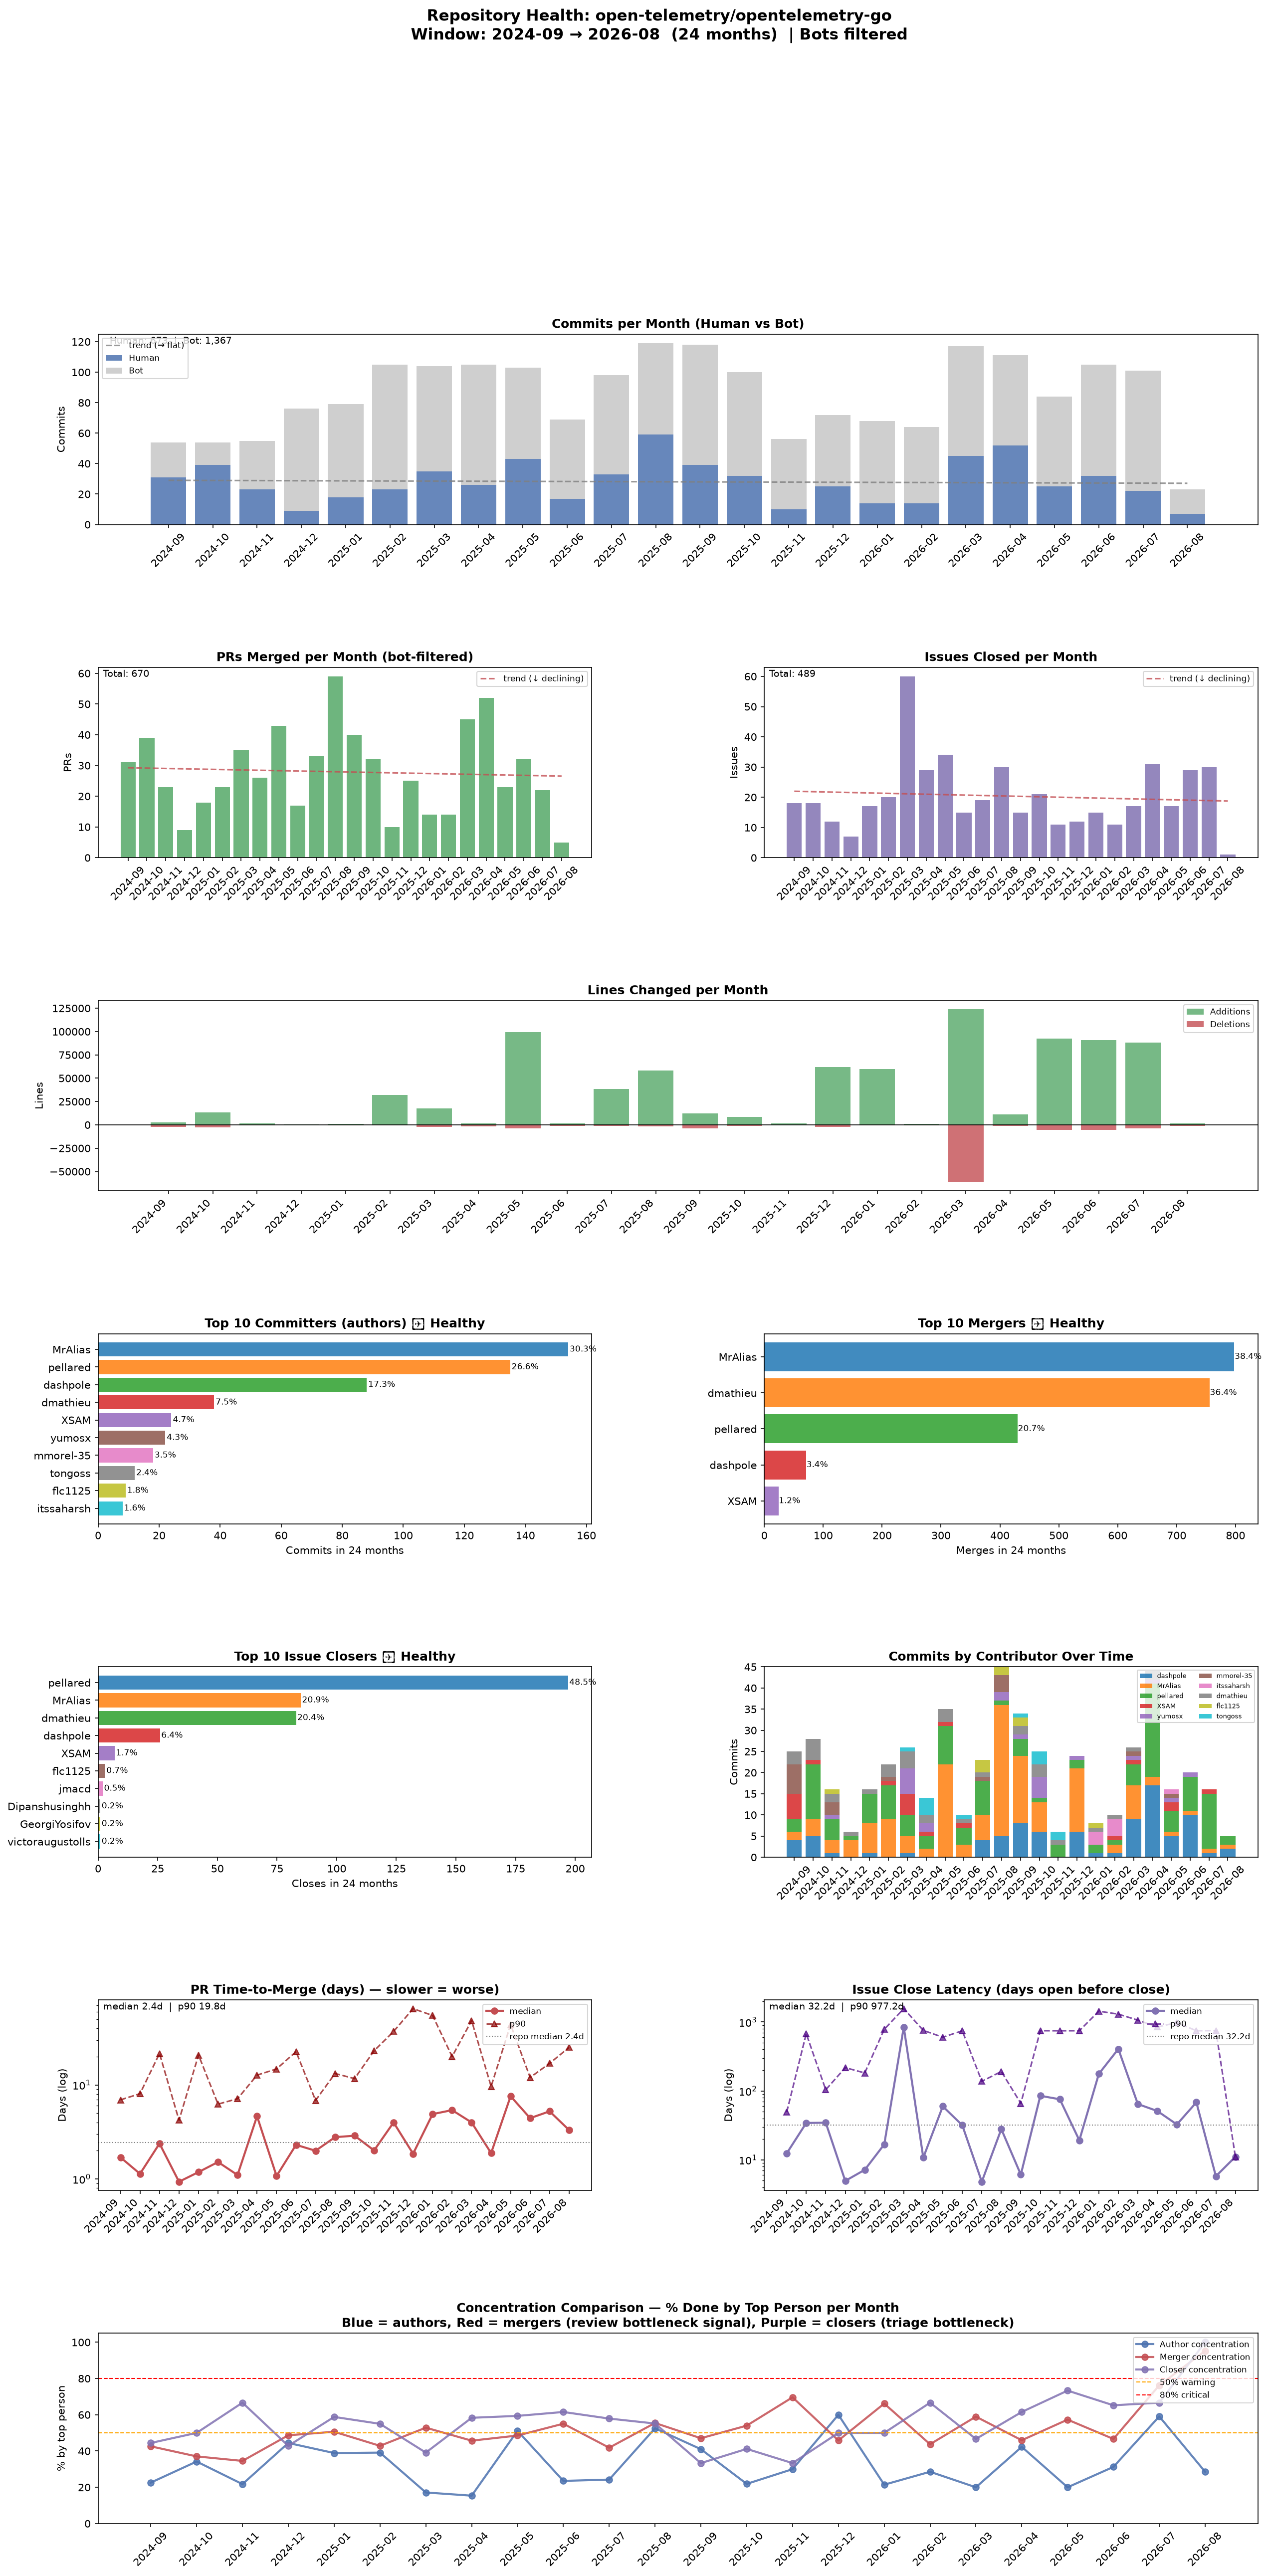
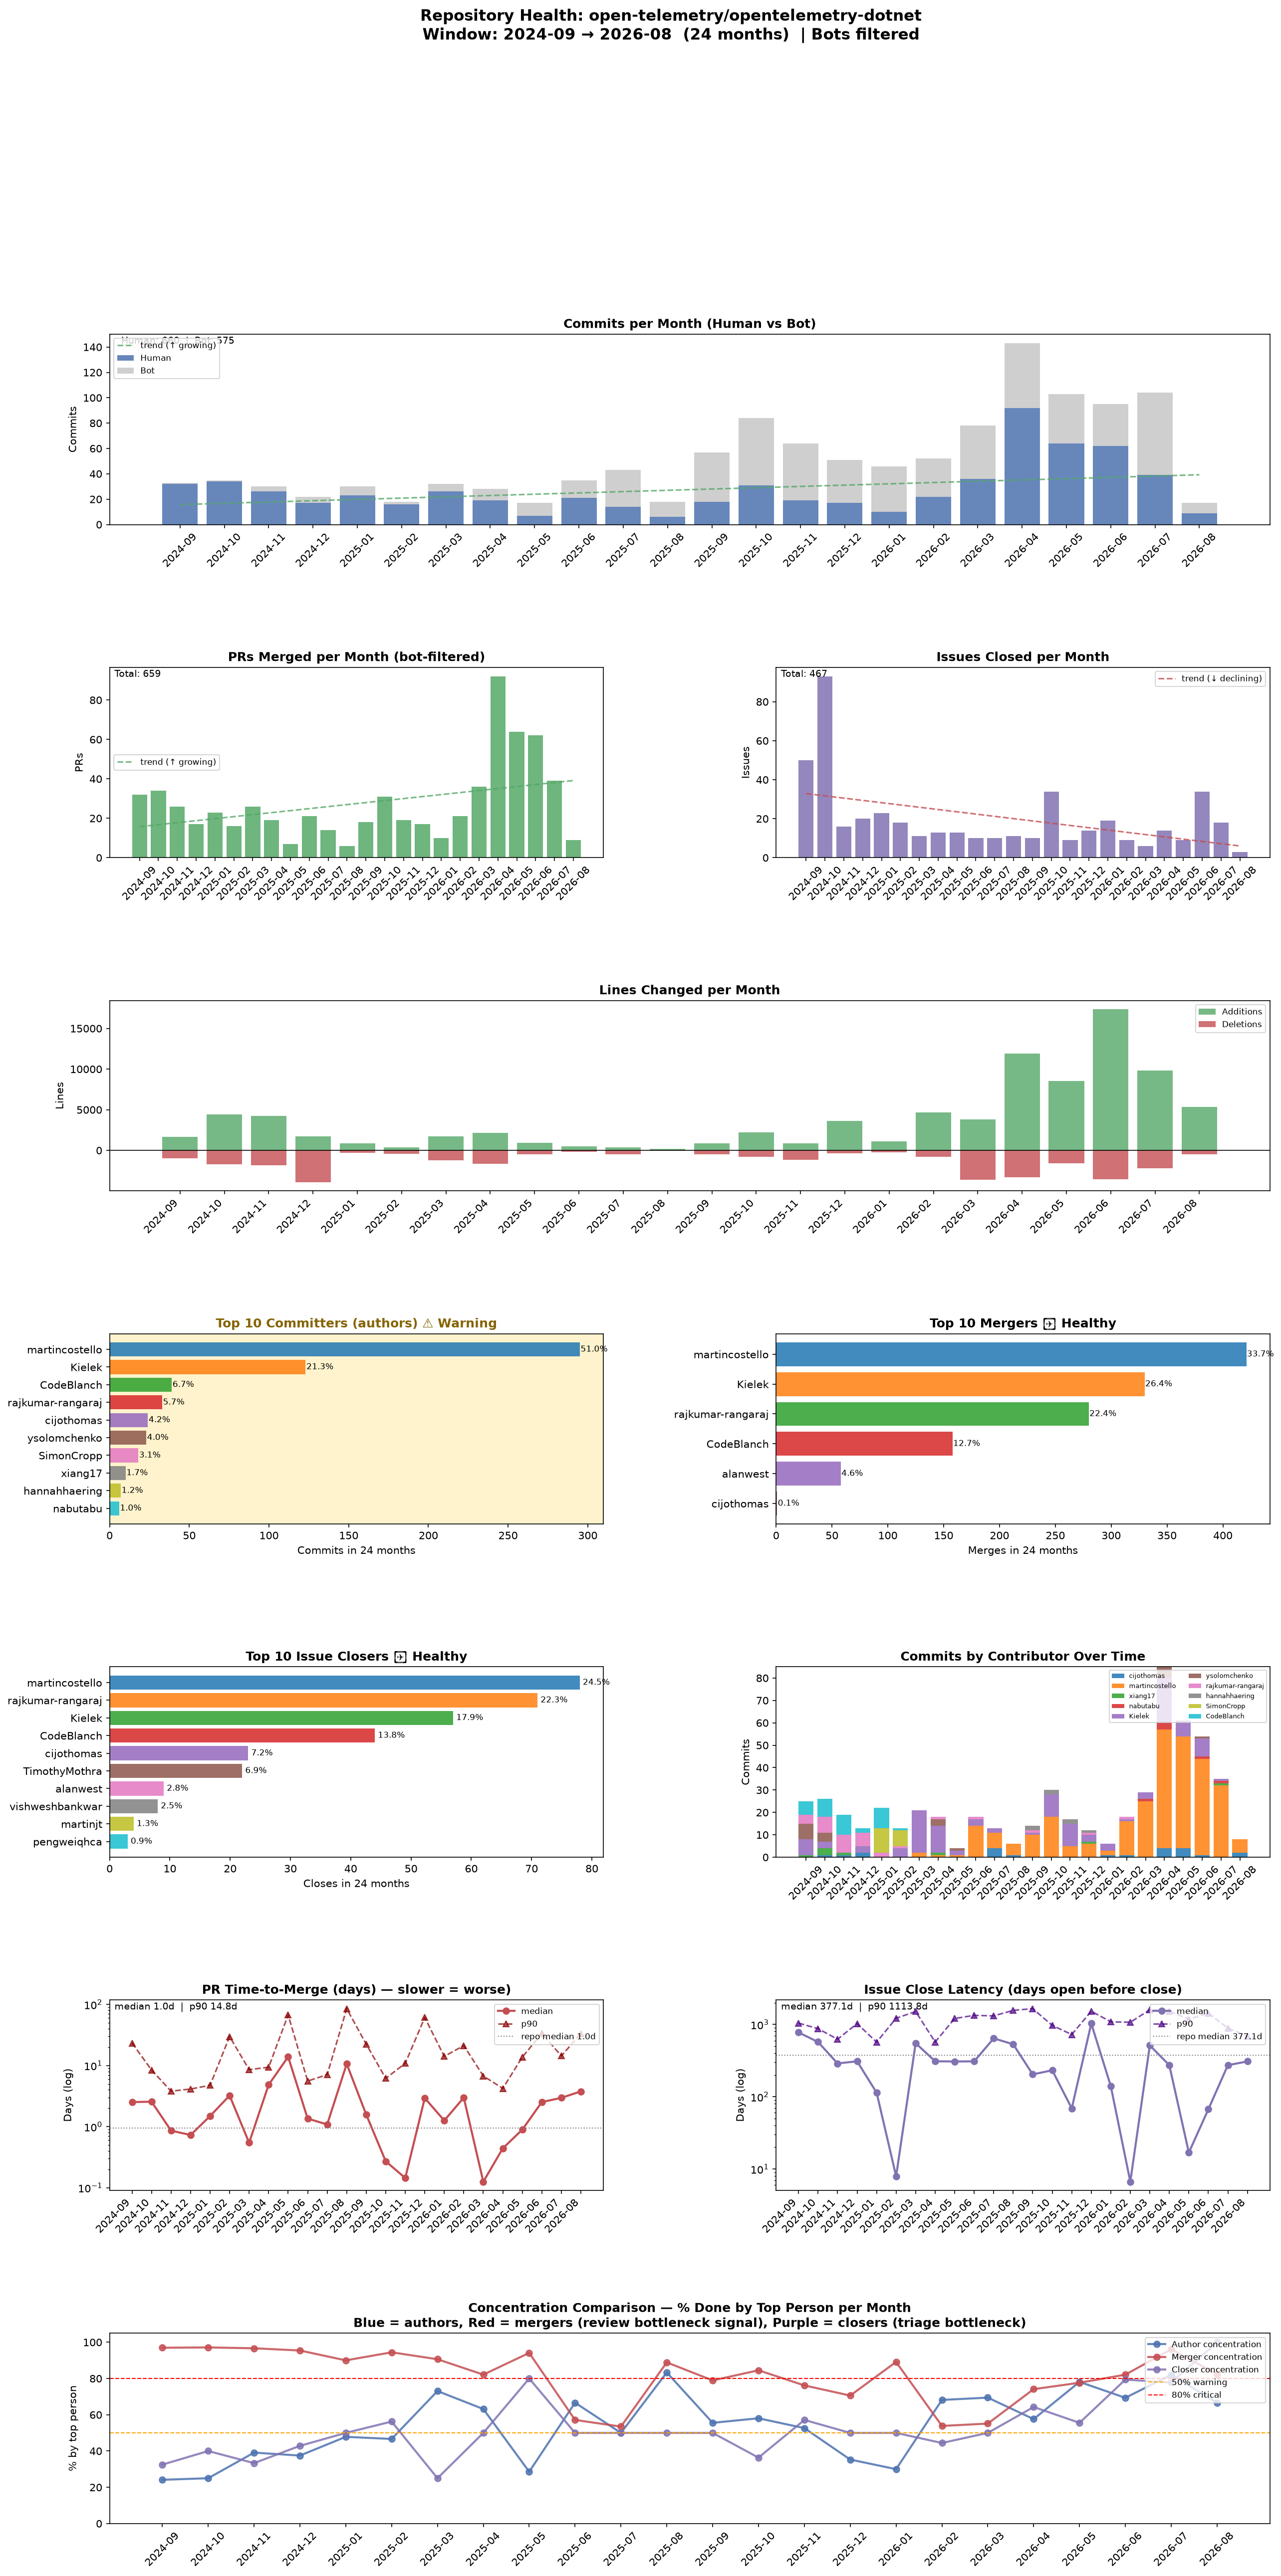
So the first issue is maybe the least surprising. There's too much concentration among too few maintainers. Your authors shouldn't also be your mergers and your issue closers. Ideally these tasks should be distributed out more evenly.
For what its worth I think the maintainers have done a good job of attempting to keep their discussions public. It was very easy for me to find the public meeting notes of the different groups of maintainers, read through them and see what was going on. I don't get the sense that these maintainers are trying to stop people from getting involved as much as the expectations of stability have, more or less, frozen the project in place.
The issue is more a classic case of "someone has to pay the maintainers". The project is too complex for someone to realistically do this as a hobby. I think any project signing on for such long stability contracts cannot turn to the community of hobbyists expecting assistance. I can't join calls and do the things I would be expected to do for a project of this size and importance for free. But it also means that the people doing this critical work have expectations placed on them by their parent organizations.
| Repository | 24mo Merged PRs | Distinct Mergers | Top-1 Merger % | Top Merger Role |
|---|---|---|---|---|
opentelemetry-cpp |
544 | 4 | 86.1% | Single human (marcalff) |
opentelemetry-kotlin |
281 | 2 | 79.7% | Single human (fractalwrench) |
opentelemetry-browser |
102 | 4 | 79.5% | Single human |
opentelemetry-ruby |
213 | 5 | 78.7% | Single human |
opentelemetry-js |
829 | 14 | 64.9% | Highly concentrated |
opentelemetry-python |
486 | 4 | 61.4% | Single human (xrmx) |
opentelemetry-php |
181 | 2 | 53.0% | Two mergers total |
semantic-conventions |
911 | 9 | 49.7% | Single human (lmolkova) |
opentelemetry-go |
686 | 5 | 36.9% | Distributed bench |
opentelemetry-dotnet |
657 | 6 | 31.5% | Distributed bench |
prometheus |
1,849 | 31 | 14.4% | Broad bench |
envoy |
5,432 | 28 | 35.8% | Broad bench |
So these SDKs have too few maintainers. But that doesn't fully explain why it seems to take so long for new features to get through the stack. My guess for that was that somewhere in the process between submission of the new idea and the formalization of the idea was a long discussion that took a million years.
Conventions about Semantics
So with this level of surface area across different frameworks and languages, it makes sense to concentrate the conversation about conventions in one place. That lives here: https://github.com/open-telemetry/semantic-conventions
If vendor debate is causing the slowdown, we should (in theory) see this slowdown in PRs here. Then you should see the slowdown basically propagate out. Spoiler alert, I was wrong about this. Big thanks to the OpenTelemetry people for having good conventions on labeling their PRs which made this much easier.
So if semconv is the slowdown, let's look at the slowest PRs there.
| PR | days | comments | reviews | labels | topic |
|---|---|---|---|---|---|
| #2083 | 277.5 | 17 | 115 | area:gen-ai | MCP semantic conventions |
| #2617 | 258.6 | 29 | 13 | area:gcp | GCE instance labels |
| #1698 | 187.9 | 3 | 7 | area:azure, breaking | rename `azure_` → `azure.` |
| #2619 | 174.6 | 24 | 8 | area:gcp | GCE instance group manager |
| #3118 | 147.1 | 19 | 8 | area:graphql, breaking | GraphQL Recommended vs Opt-In |
| #1741 | 141.0 | 4 | 23 | changelog.opentelemetry.io | Mainframes |
| #1784 | 127.3 | 7 | 48 | area:k8s | k8s.container.status metrics |
| #2287 | 118.5 | 12 | 95 | area:rpc | ONC/Sun RPC + NFS metrics |
| #2179 | 117.0 | 7 | 114 | area:gen-ai, breaking | Gen-AI chat history attributes |
Yeah some of them are pretty slow, but there are some complex topics being discussed. However interestingly this slowdown doesn't really trickle into the SDK/API space, suggesting that OpenTelemetry is going a good job of keeping these conversations siloed off.
If we look at Python we see that their slowest PRs aren't semconv related.
| PR | days | comments | reviews | labels | topic |
|---|---|---|---|---|---|
| #4646 | 361.1 | 5 | 19 | — | OpAMP integration sketch |
| #4576 | 314.0 | 11 | 27 | Stale | OTLP HTTP max_export_batch_size |
| #4609 | 253.7 | 2 | 9 | — | env carrier |
| #4709 | 172.1 | 8 | 40 | — | http exporter error handling |
| #4333 | 164.9 | 6 | 4 | — | GRPC exporter backoff config |
| #4654 | 161.7 | 7 | 14 | log-breaking-changes | deprecate events API/SDK |
| #4863 | 155.0 | 5 | 36 | — | add/remove metric readers at runtime |
| #4647 | 152.9 | 4 | 9 | Approve Public API check, log-breaking-changes | rename Log → LogRecord |
| #4854 | 150.5 | 7 | 9 | hold | W3C traceparent random-trace-id |
| #4676 | 126.4 | 20 | 30 | Approve Public API check, log-breaking-changes | logs SDK refactor |
In reality the slowdown for these are the extra required check imposed by the Approve Public API check which requires another maintainer. But that seems appropriate and takes us back to the initial problem of "not enough maintainers".
Potential Solutions
So after looking at all of this, the pattern becomes clear. A new feature takes a very long time to make it to the end user in OpenTelemetry because they take stability very seriously, combined with a relatively limited bench of talent to pull from. Once things make it through the entire stack, implementing the API and getting that API change through to the end user falls on an overworked maintainer pool. So what do we do?
I think one idea worth exploring is adding some sort of time-bound beta tier. Basically between the "Experimental" and the "Stable" in the following diagram. The problem is that for end users, due to the extra steps to use Experimental features, they might as well not exist. 99% of us have no idea when an experimental feature is added and we would never engage with it. But if I knew the feature would stick around for at least 12 months without a removal and was more accessible to me as an end user, it could actually help the project get more actionable feedback.
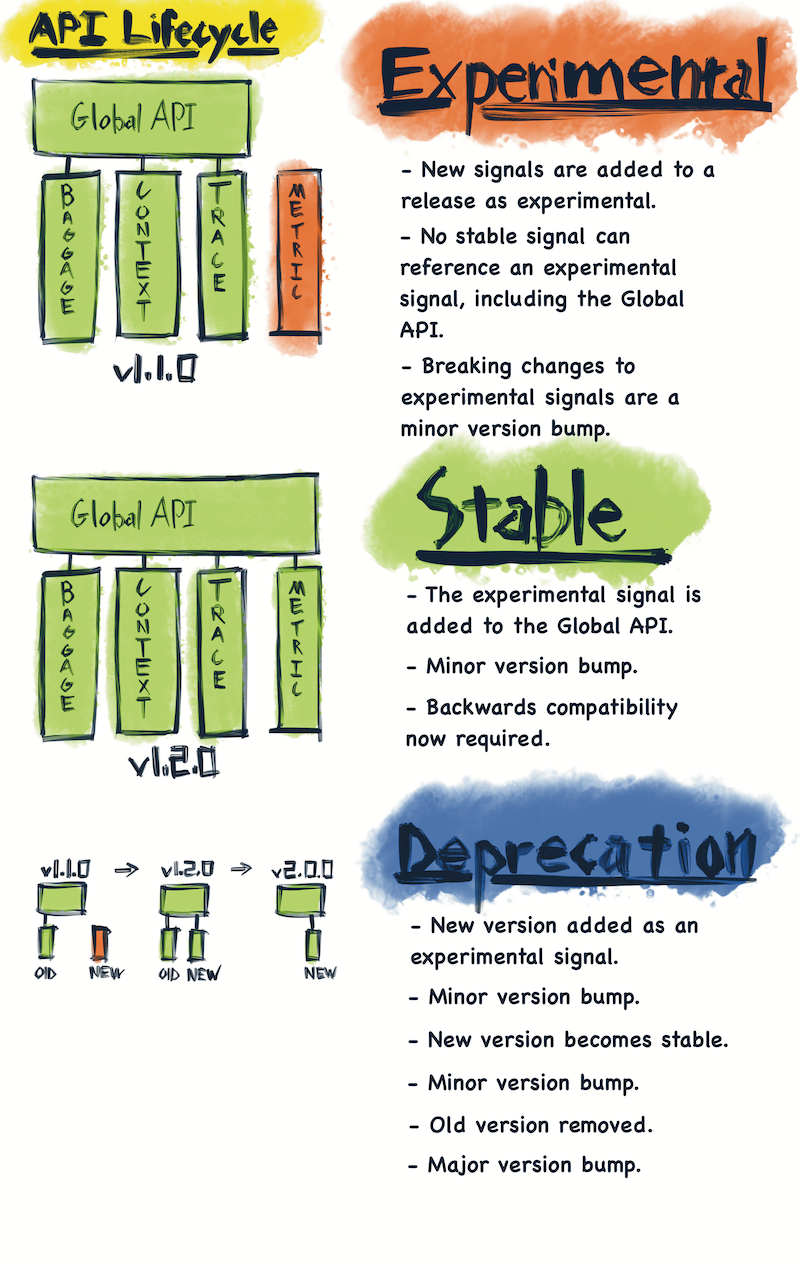
Basically a feature would go Experimental (pretty low usage) -> Beta (more exposed to the end user than Experimental) -> 12 months -> Removal or Stable.
Now confusingly Beta exists for Otel but is used for SDKs, not for components. Like Rust is a Beta but it seems like Profiles cannot be a Beta. Honestly it's nearly impossible for me to figure out like what labels should apply to what things. I suspect nobody really knows. Here's the explanation of Beta that I think only applies to SDKs.
Development

Not all pieces of the component are in place yet, and it might not be available for users yet. Bugs and performance issues are expected to be reported. User feedback around the UX of the component is desired, such as for configuration options, component observability, technical implementation details, and planned use-cases for the component. Configuration options might break often depending on how things evolve. The component SHOULD NOT be used in production. The component MAY be removed without prior notice.

Alpha

This is the default level: any components with no explicit maturity level should be assumed to be "Alpha". The component is ready to be used for limited non-critical production workloads, and the authors of this component welcome user feedback. Bugs and performance problems are encouraged to be reported, but component owners might not work on them immediately. The component's interface and configuration options might often change without backward compatibility guarantees. Components at this stage might be dropped at any time without notice.

Beta

Same as Alpha, but the interfaces (API, configuration, generated telemetry) are treated as stable whenever possible. While there might be breaking changes between releases, component owners should try to minimize them. A component at this stage is expected to have had exposure to non-critical production workloads already during its Alpha phase, making it suitable for broader usage.

Release Candidate

The component is feature-complete and ready for broader usage. The component is ready to be declared stable, it might just need to be tested in more production environments before that can happen. Bugs and performance problems are expected to be reported, and there's an expectation that the component owners will work on them. Breaking changes, including configuration options and the component's output, are only allowed under special circumstances. Whenever possible, users should be given prior notice of the breaking changes.
Stable

The component is ready for general availability. Bugs and performance problems should be reported, and there's an expectation that the component owners will work on them. Breaking changes, including configuration options and the component's output, are only allowed under special circumstances. Whenever possible, users should be given prior notice of the breaking changes.

Deprecated

Development of this component is halted. No new versions are planned, and the component might be removed from its included distributions. Note that new issues will likely not be worked on except for critical security issues. Components that are included in distributions are expected to exist for at least two minor releases or six months, whichever happens later. They also MUST communicate in which version they will be removed, either in terms of a concrete version number or the date of a release, like: "the first release after 2023-08-01".

Unmaintained

A component identified as unmaintained does not have an active code owner. Such components may have never been assigned a code owner, or a previously active code owner has not responded to requests for feedback within 6 weeks of being contacted. Issues and pull requests for unmaintained components SHOULD be labeled as such. After 6 months of being unmaintained, these components MAY be deprecated. Unmaintained components are actively seeking contributors to become code owners.
In addition it is, respectfully, misleading to imply that Go and Ruby are being maintained at the same standard. This isn't a shot at the Ruby folks — they are doing heroic work with what they have. But pretending parity exists when it doesn't just creates confusion and quiet resentment when a user shows up expecting one experience and gets another. Being honest about maintenance tiers would let people make informed choices and might attract more help to the other tiers by naming the problem out loud.
Finally I would try to surface these problems more openly for OpenTelemetry from the perspective of "we need more maintainers". I feel like the people doing this work probably knew there was a problem, but it seems like the community at large has no idea that there is a need for frankly more engaged ideally independent maintainers and contributors.
OpenTelemetry is a great project that is doing great work. It's doing, frankly, heroic work at this scale with this few people. But I think in order to actually replace the vendor specific SDKs we need to start getting a bit more pragmatic about what is realistic to do in terms of stability contracts and number of languages. I don't think breaking changes are as devastating to the community as these promises imply as long as they are communicated well and I think with this thin of a bench of maintainers, something has to give.
Anyway feel free to check my data for accuracy and let me know if you find problems!